rMaps
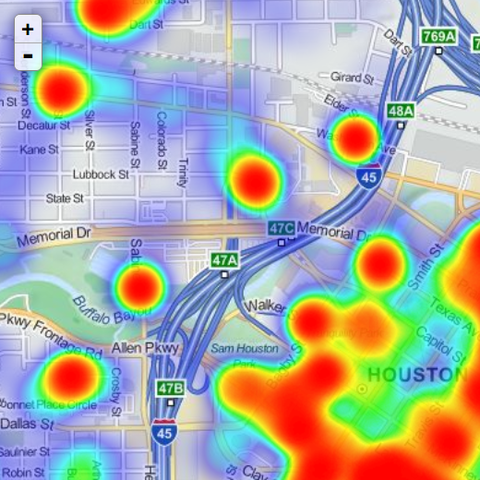
The rMaps package makes it easy to create, customize and share interactive maps from R, with a few lines of code. It supports several javascript based mapping libraries like Leaflet, DataMaps and Crosslet.
To make full use of the development data revolution, statisticians must take advantage of technological advancement and innovative approaches to data collection, analysis and dissemination to improve the way they analyse and disseminate statistics and thereby encourage wider use of statistics.
PARIS21 is committed to help statistical systems to improve their data dissemination practices as a means of promoting evidence-based policy-making and decisions at the country level. With the aim of sustaining the capacity building program for statistical systems, PARIS21 partners with national and regional institutions in training activities on data communication and visualisation.
The workshops serve as a venue for collaboration between statisticians to adopt the data visualisation tools and ensure wider use in the statistical system. To tailor the content to local training requirements, participants are invited to take a short pre-course survey.

The rMaps package makes it easy to create, customize and share interactive maps from R, with a few lines of code. It supports several javascript based mapping libraries like Leaflet, DataMaps and Crosslet.

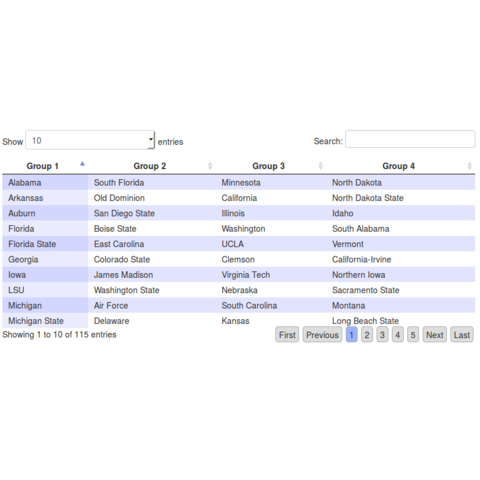
The rCharts package allows you to create, customize and publish interactive javascript visualisations from R using a lattice style plotting interface.
| Time | Session | Resources |
|---|---|---|
| 11:00 - 12:00 | 1. Examples and Overview of Tools for Data Visualisations
|
Slides pizza.R |
| 13:30 - 14:30 | 2. Best Practices for Data Visualisations
|
Slides R reference card |
| 14:45 - 16:00 | 3. Workflow of Statistical Data Analysis: A Demonstration
|
ggplot2 cheatsheet |
| 16:15 - 17:15 | 4. Hands-on Breakout Sessions: Interactive Data Visualisations
|
Slides |
| 09:00 - 10:15 | 5. Interactive reports
|
Slides project.zip rmarkdown cheatsheet |
| 10:30 - 11:45 | 6. Hands-on Breakout Sessions (cont'd)
|
-- |
| 13:30 - 15:00 | 7. Hands-on Breakout Sessions (cont'd)
|
-- |
| 15:15 - 16:30 | 8. Next Steps: Finding Help and Resources
|
Slides Evaluation form |
For the lab sessions we will use the open source software environment R. I think that it is helpful to coordinate on one environment. R has the advantage of being free and rather powerful. Read about R in this New York Times article.
Download on left side, click: CRANbase (Binaries for base distribution)Download R 3.2.3 for Windows (62 megabytes) to save and run Setup program: R-3.2.3-win62.exehelp or ?? (use, for example, help("plot") or ??plot in the console) but also through the R manual Homepage. Useful tools from the CRAN project are An Introduction to R and the R Reference Card. Other manuals are available on the website.I also recommend using RStudio as a front end.
Download RStudioRStudio Desktop, select the Open Source Edition and click Download RStudio DesktopWindows Vista/7/8/10Help menu and click Check for Updates. This is the most conservative method to look for updates; new versions are posted to the web site frequently, but RStudio support team does not advertise them to existing installations as often.Many of the packages require that you have Rtools installed in addition to base R.
To get the latest stable version of a package from CRAN:
install.packages("packagename")
library(packagename)
To get the most recent development version of a package from GitHub:
install.packages("devtools")
devtools::install_github("author/packagename")
library(packagename)
For example, to use the rCharts and rMaps packages, you do
devtools::install_github("author/packagename")
install_github('ramnathv/rCharts')
install_github('ramnathv/rMaps')
library(rCharts)
library(rMaps)
Copyright © 2025 - Thilo Klein - Powered by Jekyll Experiment