FAQ II
This FAQ for Quantitative Methods II and Econometrics II is a compilation of questions and answers that where posted on the course forum in previous years. For more comprehensive FAQs on R and statistics, see http://ats.ucla.edu and http://cran.r-project.org.
Course resources
R commands
- How do I group (time series) data by a variable?
- Can you explain why we use ‘dynlm’ instead of just ‘lm’ in time series regression?
- How do I force the drift term to equal zero when estimating an ARMA model in R?
- What does the ‘fixed’ option achieve in the arima function?
- How do we restrict the graphs of the ACF/PACF not to show t=0, where ACF=1?
- Is there an easy way to extract the significance values (dotted lines) from the ACF/PACF graphs?
- How do I fix the parameters of the MA process in the variance.model specification of my GARCH(p,q) model?
- Is it possible to force the auto.arima function to ignore seasonal differencing?
- How to plot arima forecasts with error bounds?
- What is the difference between and ARIMA with non zero mean and with zero mean. How do we specify for each case in R?
- How do I translate the forecasted values into the original form of data (instead of log difference)?
- How can I read date formats in R?
- How do I add an extra column to a dataframe for which the values are based on calculations within levels of another factor?*
- The generic function fitted does not work when applied to plm. How do I get fitted values from a plm?*
- What does ‘idiosyncratic’ and ‘individual’ mean in the summary() of my random effects model?*
Error messages
- If when doing the ugarchfit I get ‘no convergence’, what can be done to solve this?
- I have been receiving the following error message: ‘Error: could not find function “adf.test.1”’. Why is that?
- I get the following error: “Error in window.default(x, …) : ‘start’ cannot be after ‘end’”. What am I doing wrong?
- What does this warning message mean: “serie x is constant and has been removed”?
Statistical concepts
- How do we distinguish graphically / formally between deterministic and stochastic non-stationarity?
- How does plotting the ACF and PACF help to assess Stationarity?
- How many lags shall I include in the ADF test?
- Is the initial number of lags in an Distributed Lag model arbitrarily chosen?
- Why is it sometimes preferrable to use log differences instead of simple first differences in time series data?
- If we perform Ljung-Box test on residuals of the Dickey-Fuller test, is rho_i then the i-th autocorrelation between u_t and u_(t-i)?
- Will the function auto.arima() give us the “best” model?
- In the second step of Ender’s procedure for testing unit root, if we reject the null, then we ‘test gamma=0 using normal distribution’. Which test should we use for this?
- If AIC turns negative, shall we look at the real number or shall we focus on its absolute value?
- For ARCH tests, how should we choose the lags?
- When choosing a GARCH model, do we only look at ACF/PACF plots, or are there any other ways?
- Suppose you have two competing models, one with lower AIC but insignificant coefficients, whilst the other one has higher AIC but all insignificant coefficients dropped. Which one to choose?
- Could you please explain how adf.test() determines the lag length and why it uses this particular rule of thumb: (n-1)^(1/3)?
- How come the Ljung-Box-test suggests no autocorrelation but the acf/pacf does?
- How many data points would I need to forecast to assess the models? I would have thought “the last few months” would be too little data points to conclusively say one model is better than another?
- What is the proper way to select the “best” ARIMA model and what happens if the model fails one of the diagnostic tests?
- Is there a formal test of invertibility? Is it necessary to show that the process are invertible?
- I get different coefficient estimates for eg ARMA(1,1) and ARIMA(1,0,1) models on the same data. Why is that?
- Coefficients that were significant in ARMA became insignificant when I estimate GARCH. Why is that?
- How should I calculate the marginal effect in a probit model for a binary independent variable?*
- Say we have a single endogenous variable, X, and a single instrument, Z. This scenario is exactly identified, does this mean we cannot test for overidentifying restrictions?*
- We have covered two types of Sargan test. I have an example where they give conflicting results. Which type of Sargan test would be more reliable?*
- I have panel data with monthly observations over 9 years. Should I include all these variables in my model?*
Organisation
- I have a question on the course material. Where do I get an answer?
- Which questions should be reserved for office hours?
- Can you write me a reference letter?
- Can you supervise my M.Phil. dissertation?
- I don’t like the course the way it is. What can I do?
- I like this course!
- Lectures, handout, workshops, exercises, contest… – do I have to do all this?
* Questions marked with an asterisk are for the Quantitative Methods II course.
Course resources
Can you explain what the functions adf.test.1() and adf.test.2() do? How are they different from R’s adf.test() function?
adf.test.1() and adf.test.2() are convenience functions that I wrote. adf.test.2() gives the adf test specification. If you apply the summary() command, p-values would be wrong because they are based on the t-distribution! To obtain the correct p-value based on the Dickey-Fuller distribution use the adf.test.1() function. The sole difference between the latter and R’s standard adf test function is that it allows to specify whether to include an intercept and/or a trend variable.
R commands
How do I group (time series) data by a variable?
The following commands select the first [1] observation for any given date year and bind the outcome in a vector.
Generate the data
year    <- sort(rep(2010:2011,4))

quarter <- rep(c("Q1","Q2","Q3","Q4"), 2)
index   <- sort(rep(c(100,105),4))
data    <- data.frame(year,quarter,index); data
  year quarter index
1 2010      Q1   100
2 2010      Q2   100
3 2010      Q3   100
4 2010      Q4   100
5 2011      Q1   105
6 2011      Q2   105
7 2011      Q3   105
8 2011      Q4   105
Option 1: by function
by(data, data$year, myfunction <- function(x) x[1,])
data$year: 2010
  year quarter index
1 2010      Q1   100
------------------------------
data$year: 2011
  year quarter index
5 2011      Q1   105
Option2 : aggregate function
aggregate(data, list(Grouped.by=year), myfunction <- function(x) x[1])
  Grouped.by year quarter index
1       2010 2010      Q1   100
2       2011 2011      Q1   105
Option 3: sapply function
sapply(data, function(x) x[seq(1,8,4)])
     year quarter index
[1,] 2010       1   100
[2,] 2011       1   105
For a detailed treatment of the apply-functions, see the UCLA site.
Can you explain why we use ‘dynlm’ instead of just ‘lm’ in time series regression?
It is simply more convenient to use the dynlm function because it allows for a more flexible model specification. dynlm and lm will both give the same estimates.
How do I force the drift term to equal zero when estimating an ARMA model in R?
Have a look at the help files for the arma and arima functions? If you want to estimate a model without intercept, the options are include.intercept=FALSE (for arma) and include.mean=FALSE (for arima).
What does the ‘fixed’ option achieve in the arima function?
Suppose you were estimating an ARIMA(1,(1,4)) model with order=c(1,0,4). How can we force the ma2 and ma3 coefficients to be 0? This is accomplished by the fixed option, and best illustrated using an example.
quart <- read.csv("http://klein.uk/R/Lent/quarterly.csv")
arima(quart$DLPPI, order=c(1,0,4), fixed=c(NA, NA, 0, 0, NA, NA))
Coefficients:
         ar1      ma1  ma2  ma3     ma4  intercept
      0.7636  -0.3531    0    0  0.2862     0.0075
s.e.  0.0809   0.1049    0    0  0.0980     0.0032
The structure should get clearer now. You can see that setting an NA allows the corresponding coefficient to be estimated, and 0 forces the coefficient to be zero. What needs getting used to is the order of the terms in the fixed option. First, we have the ar1 term (here: NA), then four ma terms (here: NA, 0, 0, NA) and finally the intercept (here: NA).
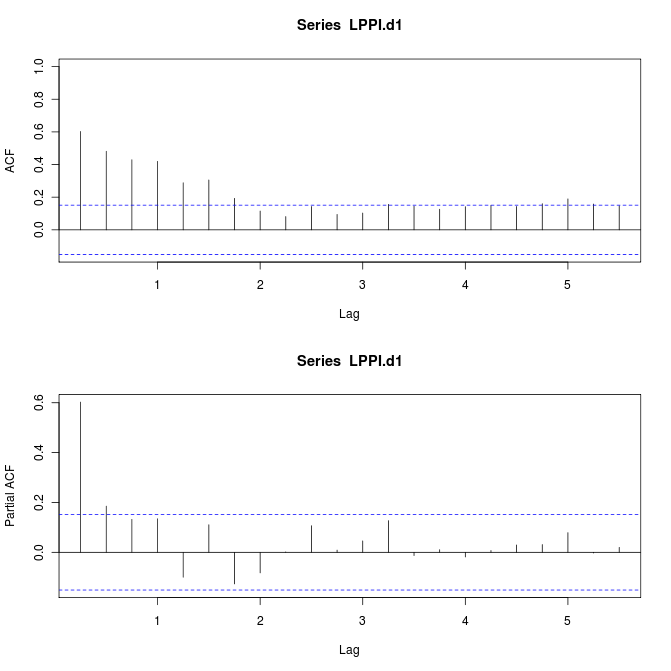
How do we restrict the graphs of the ACF/PACF not to show t=0, where ACF=1?
See Exercise 1b in Lab Session 2. This is accomplished by changing the range of the x-axis from the default c(min=0,max=5.5) to c(min=0.25,5.5).
Generate variables
quart   <- read.csv("http://klein.uk/R/Lent/quarterly.csv")
PPI     <- ts(quart$PPI, start=c(1960, 1), freq=4)
LPPI    <- ts(log(PPI), start=c(1960, 1), freq=4)
LPPI.d1 <- diff(LPPI, lag=1, differences=1)
Plot acf/pacf
par(mfrow=c(2,1))
acf(LPPI.d1); pacf(LPPI.d1)

Get rid of 0 lag autocorrelation in acf
acf(LPPI.d1, xlim=c(0.25,5.5)); pacf(LPPI.d1)
Is there an easy way to extract the significance values (dotted lines) from the ACF/PACF graphs?
I am also still searching for this one… please share with me in case you come across the p-values for acf/pacf functions in R. For now you can either use the Ljung-Box-test for (joint) inference, or Barlett’s approximation as follows. “In large samples the sample autocorrelation coefficients are normally distributed with zero mean and variance equal to one over the sample size” (Gujarati, ‘Basic Econometrics’, 4th edition, page 812). A 95% confidence interval for any autocorrelation coefficient, rho_k, is then given by rho_k +/- 1.96*(sqrt(1/n)), where n is the sample size.
How do I fix the parameters of the MA process in the variance.model specification of my GARCH(p,q) model?
To force the coef of the first ARCH term to be zero, simply use the command fixed.pars=list(alpha1=0) in the model specification.
Is it possible to force the auto.arima function to ignore seasonal differencing?
You can force auto.arima to ignore seasonal differencing using the following arguments: D=0, max.P=0, max.Q=0
How to plot arima forecasts with error bounds?
First, fit an ARMA model to some simulated data
x     = arima.sim(list(order=c(1,0,1),ar=.9,ma=-.5),n=100) # simulate data
x.fit = arima(x, order = c(1, 0, 1)) # fit model & print results
then forecast 10 ahead
x.fore = predict(x.fit, n.ahead=10)
and plot the forecasts (with error bounds).
U    = x.fore$pred + 2*x.fore$se
L    = x.fore$pred - 2*x.fore$se
minx = min(x,L)
maxx = max(x,U)
ts.plot(x,x.fore$pred,col=1:2, ylim=c(minx,maxx))
lines(U, col="blue", lty="dashed")
lines(L, col="blue", lty="dashed")
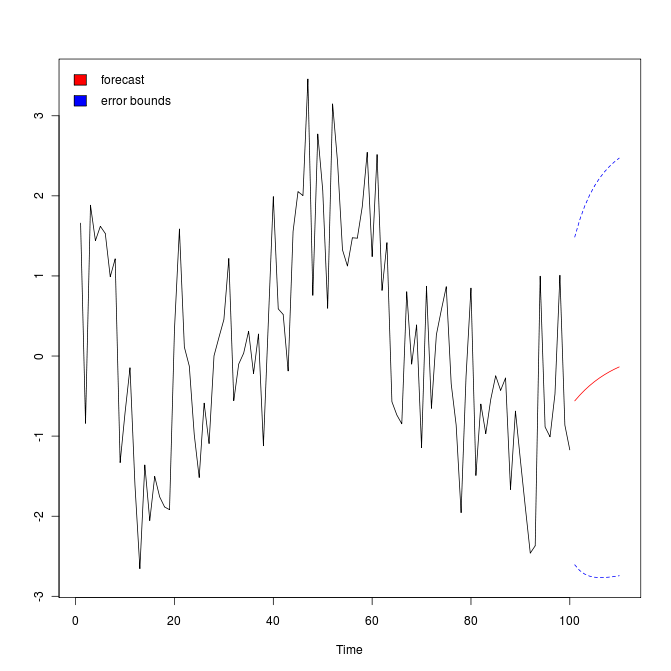
This example is taken from here.
What is the difference between and ARIMA with non zero mean and with zero mean. How do we specify for each case in R?
A quote from the R-help in ?arima:
Option: include.mean -- Should the ARMA model include a mean/intercept term? The default is TRUE for undifferenced series, and it is ignored for ARIMA models with differencing.
When working with arima models, consider “Issue 1: When is the intercept the mean?” here. “When fitting ARIMA models, R calls the estimate of the mean, the estimate of the intercept.”
Fortunately, replacing "intercept" by "mean" in the arima model output fixes Issue 1. On Issue 2, if the mean is zero you can ignore the issue and proceed. If not use the xreg option or simply difference the series using diff() instead.
How do I translate the forecasted values into the original form of data (instead of log difference)?
You know that the log difference gives the growth rate, g, so to obtain a one step ahead forecast from y_t to y_t+1, you could just do y_t * (1 + g_t+1). To obtain forecast errors (MSE, MAE, ..) and the like you can still use g directly.
How can I read date formats in R?
This is best illustrated with an example. Let us first generate a vector of dates.
dates <- factor(c("1/8/2000", "1/9/2000", "1/10/2000", "1/11/2000")); dates
[1] 1/8/2000  1/9/2000  1/10/2000 1/11/2000
Levels: 1/10/2000 1/11/2000 1/8/2000 1/9/2000
Then check this for the appropriate date format.
%m -- Month as decimal number (01-12).
%d -- Day of the month as decimal number (01-31).
%Y -- Year with century.
Use the as.Date() function to convert the vector into date format as follows.
dates2 <- as.Date(dates, format="%m/%d/%Y"); dates2
[1] "2000-01-08" "2000-01-09" "2000-01-10" "2000-01-11"
The relevance of this transformation becomes clear when we try to sort the data by date. You will find that this is not possible with the original factor variable date, e.g., January 8th (1/8/2000) should come before January 10th (1/10/2000).
sort(dates)
[1] 1/10/2000 1/11/2000 1/8/2000  1/9/2000
Levels: 1/10/2000 1/11/2000 1/8/2000 1/9/2000
However, when R recongnises the date format of the variable, it gets things right.
sort(dates2)
[1] "2000-01-08" "2000-01-09" "2000-01-10" "2000-01-11"
How do I add an extra column to a dataframe for which the values are based on calculations within levels of another factor?
In the table below, the value of the new variable is 1 if value = max(value) in class i (=1,2,3); and 0 otherwise. The solution outlined below uses the functions by, merge, and lapply.
Generate the data:
class <- c(1,1,1,2,3,3)
value <- c(5,90,100, 55,60,10)
new   <- rep(NA,6)
data  <- data.frame(class, value, new); data
  class value new
1     1     5  NA
2     1    90  NA
3     1   100  NA
4     2    55  NA
5     3    60  NA
6     3    10  NA
Get max by class
x   <- c( by(data$value, data$class, max) )
idx <- c( by(data$class, data$class, max) )
dx  <- data.frame(idx,x); dx
  idx   x
1   1 100
2   2  55
3   3  60
Merge the max with your obs (in Excel this is vlookup :o)
data2 <- merge(dx,data,by.x=1,by.y=1); data2
  idx   x value new
1   1 100     5  NA
2   1 100    90  NA
3   1 100   100  NA
4   2  55    55  NA
5   3  60    60  NA
6   3  60    10  NA
Apply indicator function to obtain binary variable
data2$new <- data2$x - data2$value; data2
  idx   x value new
1   1 100     5  95
2   1 100    90  10
3   1 100   100   0
4   2  55    55   0
5   3  60    60   0
6   3  60    10  50

data2$new <- lapply(data2$new, function(x) ifelse(x==0,1,0)); data2
  idx   x value new
1   1 100     5   0
2   1 100    90   0
3   1 100   100   1
4   2  55    55   1
5   3  60    60   1
6   3  60    10   0
This is an ad-hoc solution but you may be able to generalize it to other problems. Another application would be the demeaning of variables for fixed effects estimation.
The generic function fitted does not work when applied to plm. How do I get fitted values from a plm?
The function fitted() does not seem to work for panel models. In this case, you can obtain fitted values by subtracting the estimated residuals from the actual observations as follows.
yourmodel$model[[1]] - yourmodel$residuals
What does ‘idiosyncratic’ and ‘individual’ mean in the summary() of my random effects model?
You will find an answer to your question in the plm package manual here. “idiosyncratic” error is the classical error term and “individual” error the random effect (page 2). “share” gives the respective percentage contribution to total variation.
Error messages
If when doing the ugarchfit I get ‘no convergence’, what can be done to solve this?
If this is the case for any of the lab exercises, try to reinstall the rgarch package on your machine or use the Judge computer lab for garch modelling. Simply follow the three simple steps (explained on my website) to install rgarch in the lab (R version 2.11). If the algorithm does not converge for a model in your workbook, choose a simpler specification (more parsimonious / less parameters).
I have been receiving the following error message: [Error: could not find function “adf.test.1”]. Why is that?
You need to source my convenience functions by tying:
source("http://klein.uk/R/myfunctions.R")
I get the following error: “Error in window.default(x, …) : ‘start’ cannot be after ‘end’”. What am I doing wrong?
If you get this error message (and your chosen start date is definitely not after the end date of the series) you have defined the date format incorrectly. To see how to get this right, check How can I read date formats in R?.
What does this warning message mean: “serie x is constant and has been removed”?
You don’t have to worry about that warning message. It is just telling you that there is a constant variable in the dataset which therefore is not useful in a regression. I assume, that you created a subset that only contains a factor x with only one level. In this case, the variable x is per definition equal for all observations (and collinear with the intercept!). R just notifies you that this variable is not useful and drops it, even if you don’t use it in the regression model.
Statistical concepts
How do we distinguish graphically / formally between deterministic and stochastic non-stationarity?
The nature of the trend component in time series cannot be established visually. The ADF test procedure starts with the most general model, allowing for intercept, trend and difference stationarity. If you reject unit root in this general model, then you can estimate a model for the series with intercept and trend terms and use standard OLS procedures/ t-test to check if there is a signficant trend, which needs taking out. The ADF nests both.
How does plotting the ACF and PACF help to assess Stationarity?
Take the extreme case where ACF is zero for every lag. You would then safely conclude that the series is stationary.
How many lags shall I include in the ADF test?
The lags are included to get rid of serial autocorrelation. Use adf.test.2() function to obtain residuals from the adf test regression and do the Ljung-Box-test. Increase the number of lags (k argument in adf.test.1 function) to get rid of the autocorrelation. It does make sense to include only the significant lags. In extremely nasty cases you could use the stepAIC function to determine which lags are required.
Is the initial number of lags in an Distributed Lag model arbitrarily chosen?
The number of lags is somewhat arbitrarily chosen, but it makes sense to choose it larger than 4 if we have quarterly data, larger than 12 for monthly data, etc.
Why is it sometimes preferrable to use log differences instead of simple first differences in time series data?
There are probably three advantages of taking logs when working with time series data. First, you reduce problems of extreme observations and non-normality. Remember that time series data is usually leptokurtic. Second, growth rates are a convenient measure and facilitate interpretation of your results. Third, logging could help in bringing a variable closer to stationarity.
If we perform Ljung-Box test on residuals of the Dickey-Fuller test, is rho_i then the i-th autocorrelation between u_t and u_(t-i)?
The test statistic gives you the joint significance up to the mentioned lag. So, if say, test statistic for lag 7 is significant, all the lags until that lag (first 7 lags) are jointly significant.
Will the function auto.arima() give us the “best” model?
The auto.arima() function will give you the model with the lowest AIC, for example. However, there are other criteria that determine whether a model is appropriate, e.g. residual autocorrelation etc.
In the second step of Ender’s procedure for testing unit root, if we reject the null, then we ‘test gamma=0 using normal distribution’. Which test should we use for this?
This is the simple t-test that is reported in the regression summary command summary(). You could specify the regression using adf.test.2() and then obtain the simple summary().
If AIC turns negative, shall we look at the real number or shall we focus on its absolute value?
When you look-up the definition of the AIC you will understand why this is.
AIC = -2*LogLikelihood + 2*npar or AIC = n*log(RSS) + 2*npar
When the residual sum of squares is below 1, the term log(RSS) is negative. Dependent on the values of n and npar the AIC may be positive or negative. The interpretation of the AIC measure still remains the same.
For ARCH tests, how should we choose the lags?
You should ideally choose a sequence of lags up to 15 as in the summary of the ugarchfit. The ugarchfit results give you the ArchTest based on standardized residuals, i.e. based on
sgarch.fit@fit$residuals/sgarch.fit@fit$sigma
instead of simply
sgarch.fit@fit$residuals
Please use those for your analysis (this was corrected in the R-scripts for the lectures but not for some of the exercises in the lab).
When choosing a GARCH model, do we only look at ACF/PACF plots, or are there any other ways?
Yes, to determine your starting parameters for the garch model you can only inspect acf/pacf.
Suppose you have two competing models, one with lower AIC but insignificant coefficients, whilst the other one has higher AIC but all insignificant coefficients dropped. Which one to choose?
There are possibly good reasons to select your model based on coefficient significance. EViews, for example, uses a heuristic threshold rule based on significance levels. AIC and BIC have at least some theoretical foundation. In the end all you can do is to choose a selection criterion and stick to it for consistency.
Could you please explain how adf.test() determines the lag length and why it uses this particular rule of thumb: (n-1)^(1/3)?
The choice of lag length is basically an empirical question. “A rule of thumb is to compute ACF up to one-third to one-quarter the length of the time series” (Gujarati, ‘Basic Econometrics’, 4th edition, page 812). For help on R’s default (n-1)^(1/3) please look up the help using ?adf.test.
You should not rely on this but determine the lag length based on the Ljung-Box stats. The ljung.box.test.1() function only differs from ljung.box.test by allowing you to specify the lag-length (k) to be reported.
seq(1,15,1)
gives you lag-length 1 to 15.
seq(1,10,1)
1 to 10, etc.
How come the Ljung-Box-test suggests no autocorrelation but the acf/pacf does?
The Ljung-Box-test may fail to reject the null despite significant autocorrelation at an individual lag because it tests for joint significance of autocorrelation up to a specific lag. I would use the Ljung-Box-test and ignore the significant correlation in the acf. A possible justification: Looking at individual significance tests means that you are testing multiple hypotheses at 5% level and would expect to reject one in twenty tests by pure chance.
How many data points would I need to forecast to assess the models? I would have thought “the last few months” would be too little data points to conclusively say one model is better than another?
It does not make much sense to use too long a forecast horizon because forecasts revert to the long term mean fairly quickly.
What is the proper way to select the “best” ARIMA model and what happens if the model fails one of the diagnostic tests?
Box-Jenkins procedure is recommended. If the model fails diagnostic tests try to improve it or (if its not possible with the methods we learned) comment on the shortcomings.
Is there a formal test of invertibility? Is it necessary to show that the process are invertible?
AR models are invertible (but may not be stationary). MA models are stationary, because their autocorrelation functions (theoretically) are 0 past lag q (but may not be invertible).
Invertibility condition check for MA(1)-process:
y_t = u_t + b_1 * u_t-1
If the root of this polynomial lies outside the unit circle, the MA(1) process can be forecasted because it satisfies the invertibility condition. The invertibility condition is satisfied if the absolute value of the parameter of the model satisfies |b_1|<1.
Stationarity condition check for AR(1)-process (ADF test):
y_t = u_t + a_1 * y_t-1
AR is stationary if roots of the above polynomial lie outside the unit-circle, i.e., |a_1|<1.
All ARIMA models are invertible. So we don’t need to check this condition for them :o)
Source: “Invertibility and Stationarity conditions of ARIMA models” (Sanchez, UCLA)
I get different coefficient estimates for eg ARMA(1,1) and ARIMA(1,0,1) models on the same data. Why is that?
There may be small differences between R’s arma and arima estimates. This is due to different optimization methods underlying the two functions. The arima function from the stats package uses Maximum Likelihood Estimation (MLE) whereas the arma function uses an OLS estimator (see the help files for the functions). For linear regression the estimates are exactly the same and I suppose for our time series models they are asymptotically equivalent. Please choose any of the two functions.
Coefficients that were significant in ARMA became insignificant when I estimate GARCH. Why is that?
Remember that the simple ARMA model assumes that there are no ARCH effects. This is often unrealistic. Modelling mean and variance equation simultaneously (ugrachfit function) will therefore often lead to more accurate (and hence different) models/results. You should first find an optimal mean equation (arma), and use the squared residuals arma$res^2 to determine the ARCH-structure. Second, estimate mean and variance model simultaneously (ugrachfit) and change your mean/variance specifications (using ugarchfit) to obtain a model with a good fit that satisfies the model assumptions.
How should I calculate the marginal effect in a probit model for a binary independent variable? [PID=486]
Exercise 2b, Lab Session 4. The first command
glm2b$coef[2] * dnorm(mean(M%*%coef(glm2b)))
gives the marginal effect (of the average respondent) based on the derivative of the link function with respect to the independent variable (see lecture notes: think chain rule!). This approach makes sense for continuous variables. For dummy variables, the second command is appropriate. It gives the difference in estimated probabilities for white and non-white respondents.
Say we have a single endogenous variable, X, and a single instrument, Z. This scenario is exactly identified, does this mean we cannot test for overidentifying restrictions? [PID=416]
Yes, exactly. If you don’t have overidentifying restrictions you can’t test for validity of your instrument (Sargan test). In this case you should try to find a second instrument.
We have covered two types of Sargan test. I have an example where they give conflicting results. Which type of Sargan test would be more reliable? [PID=548]
I’d recommend the Lagrange Multiplier Sargan test from the handout because it does not depend on the normality assumption of the errors.
I have panel data with monthly observations over 9 years. Should I include all these variables in my model? [PID=517]
There are several possibilities. You may try fixed effects by year plus quarterly dummies, for example.
Organisation
I have a question on the course material. Where do I get an answer?
It works best to ask your question directly in the lecture. And indeed, if at all possible, ask me and not your neighbors (o: This reduces the noise level and I can immediately address problems and avoid confusion.
Of course, there will be questions that come up only after the lecture. Here are three suggestions:
- First, try to find an answer individually and, if necessary, refer to the literature. Try to work independently – this is the aim of your studies.
- Of course, no one is born a master, and you may have several questions that you can’t find an answer to. Questions related to lectures and workshops can simply be posted on the forum. Other students, the teaching associates, and I can then comment on them. You will notice that it is not easy to formulate questions and answers clearly. The forum gives you the opportunity to gain more routine in the formulation of scientific concepts. In addition, you are certainly not the only person who would like a response. Only if you ask your question in public, can we all benefit from questions and answers.
- Finally, there are questions that have nothing to do with the lecture, but with econometrics, and that won’t let you sleep at night. In this case, please email me a brief description of what you’ve done to find a solution, and why your attempts have so far failed. I will then try to give you a hint or point you to resources. Also, consider booking an appointment at the School’s Empirics Lab, or at the University’s Statistics Clinic.
I try my best to help you, and sometimes it would be easier – in the short term – to explain a connection, instead of showing you how to find an answer yourself – in the long term, however, you will learn more in the latter approach.
Which questions should be reserved for office hours?
I answer any questions that concern you and only you – at least I will try it. These are, for example, questions regarding your study plans, individual research projects, reference letters, etc. You should prepare these questions by email. For simple requests (appointments) during the term, you can expect an answer within one business day, and we should find a date within a week.
In the interest of all students, I answer subject-related questions directly in the lectures, the workshops, or later in the forum. Please keep in mind that I teach many other students. If only a fraction of those would use the office hours to recap the material in private lessons, there would be no time for questions relating to individual aspects (study plans, individual research projects, reference letters, etc.).
This applies equally to the teaching associates. Again, it works best to ask questions on the material directly in the workshops or later in the discussion forum. The teaching associates are not paid to repeat the same material again and again in private lessons. It is also not their job to give individual students an edge over other students and provide “insider” information. Questions regarding course material and assignments are relevant to all students in the course. Please ask these questions so that everyone can benefit from the response – in lecture, workshop, or forum.
This leaves office hours with all the more time for questions that are unrelated to assignments (such as your individual research projects, individual difficulties in your studies, …). Send me an email and we will arrange an appointment in the next few days.
Can you write me a reference letter?
I can always write you a reference letter for a scholarship, a PhD programme, etc. However, my recommendation can be more or less strong. In particular your grades in my course will only determine part of the letter. Please consider the following points when asking me for a reference letter.
- Make sure that your proposed research and your referee are a good fit. A referee who is not familiar with your research area is obviously not a good recommendation for you. If your research is on development finance, experimental economics, or empirical methods, a selection panel may better undestand why you chose me as a referee and will take my letter more seriously.
- I can only write a reference letter once your workbooks for the course have been graded. If you need an early reference, one option for me is to consider your performance in the weekly contest and issue your letter at the end of Michaelmas term.
- If you can check off the above points, please send me your letter of motivation / cover letter, your research proposal, as well as an overview of your grades (transcript of records from CamSIS) if available. Please send these documents in pdf, postscript, text, or odt format (not in a microsoft .doc or .docx format). I will have a look at your documents and we will arrange an interview.
Can you supervise my M.Phil. dissertation?
No. You should find a faculty member who is interested in supervising your research. If you are not sure which scholar to approach with your research proposal, I can probably help you with that. That being said, I am more than happy to discuss the empirical aspects of your dissertation at any stage of your research. To do so, please go to Empirics Lab to arrange an appointment, or stop by at the university’s Statistics Clinic.
I don’t like the course the way it is. What can I do?
In this case, please give me an advance notice. Many things are a lot easier for you to notice (font too small, micro distorted, presentation too fast / too slow …). For me it is very frustrating to read about problems – which I could have fixed in the first term week – only in the end of term evaluation. Please notify me directly in class or just after class, send me an email, or give vent to your anger in the forum. As long as you give no feedback, I have to assume that you are very happy (o:
I like this course!
If you like something particularly well, I am of course happy to hear it (o:
Lectures, handout, workshops, exercises, contest… – do I have to do all this?
Short answer: No. Simply choose the modules that suit your learning style best.
- Learn the concepts based on handouts and recommended literature, or based on the lectures – both are possible. In particular, the lecture is not a “must” but a “can”.
- Practice as much as possible – certainly using the tasks of the contest, and, if possible, using the exercises.
- Use the feedback from the contest.
- Attending the workshops will be particularly useful if you have familiarized yourself with the exercises in advance.
It is not my goal that you work more for this course than for other, equally important courses. The components are simply supposed to help you organize your learning process adapted to you needs.